On maintaining a public dashboard
Lessons learned from hosting a mildly successful Covid-19 dashboard
Back in 2020, in the early days of the Covid-19 pandemic, it was hard to know what was really going on. In Ontario, where I live, the number of cases was still quite low in March 2020. There was still a lot of skepticism on how seriously to take the threat. I remember debating whether I should cancel my birthday party scheduled for the end of the month (spoilers: I canceled).
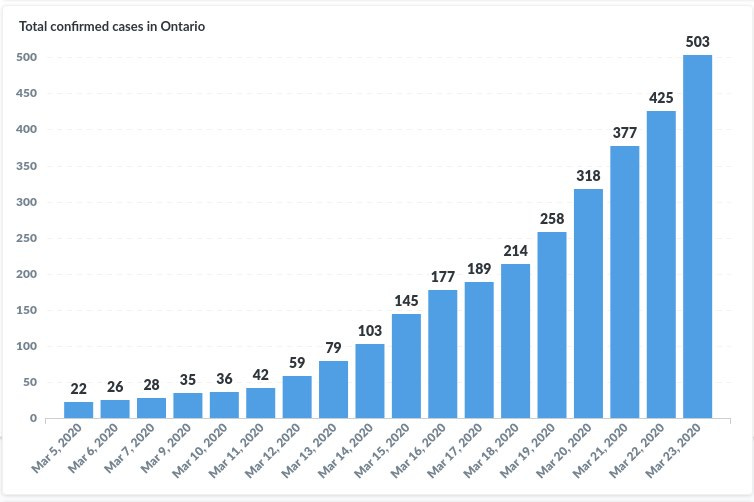
The government of Ontario was publishing daily updates on the number of cases, deaths, and tests. But these were static snapshots—the previous day's data was being replaced each day. This made it very hard to see what the trends were. The absolute numbers may have been low but, if they were increasing exponentially, it was something to worry about.
So out of anxiety and frustration, I started tracking and plotting Ontario’s Covid-19 data myself. When I started, my only data source was a single HTML table on the government of Ontario’s website which showed only the current day’s numbers.
I wrote a python script to scrape that page and store the data in a database. I used the internet archive to get historical data. I visualized the data with a Metabase dashboard and created a public page for anyone to see. The trend was clearly exponential and I started sharing it everywhere I could. In particular, on Facebook, Twitter, and Reddit.
Turns out I was not the only one with the desire to see the data presented clearly and unfiltered. Folks started reaching out to point out errors and make suggestions. I noticed other people sharing it on Reddit. Before long, my website started getting overwhelmed by traffic and I had to upgrade my servers to keep up.
I did not anticipate such heavy usage, so my server was not optimized for it. My monthly bill rose to over $300/month.1 But I felt I had to keep it online since a good number of people were relying on it to stay informed. To help cover the server costs, I put up a Buy me a coffee link. I was blown away by the support!
The comments I received from supporters further solidified my sense of responsibility. Folks are relying on this. I need to keep it accurate and up-to-date.
Easier said than done. The government, to its credit, significantly improved its data reporting. They started publishing more comprehensive datasets, accessible through a public API. But I couldn’t just automate it and forget it.
The data formats would often change on a whim, breaking my dashboard’s logic. And, as new information became available, I (along with the folks using the dashboard) wanted to include more. I learned that a good public dashboard requires constant maintenance. For over two years, I met that challenge and kept the dashboard up-to-date. When vaccines started rolling out, for example, I made a whole new page to track them.
But gradually, as my own interest faded and I got less and less inbound from folks asking for features and fixes, I would occasionally forget about the dashboard. At this point, I had it fully automated and it was costing me nothing to host.
A couple of weeks ago, my uncle reached out to tell me the dashboard had stopped updating properly. I was flattered that it was still getting used, but I decided that I did not have the bandwidth to keep maintaining it. I have a company to run and a family to support. So, while the page is still online, I’ve made it clear that it is not being maintained.
We’ve come a long way since March 2020. It’s easier to find accurate data now and this dashboard of mine is no longer as necessary. I’m very proud that it provided real utility for folks who just wanted to stay informed.
The whole experience made me realize that there is an underserved appetite amongst the general public for unbiased data visualization and reporting. People just want the data without the media spin.
For aspiring data analysts, this is a great opportunity. There is tons of data out there, especially government data, that is not being presented to the public. But remember, along with the upfront cost of building a dashboard, there will be unavoidable maintenance costs to keep it up-to-date and valuable.
Eventually, with a major refactor, I brought the server costs back to $0 by ditching Metabase and doing all the data fetching and plotting on the browser with a static site hosted by GitHub.


